- Resources
- Financial impacts of cover crops in Minnesota and the Upper Midwest
Resources
Financial impacts of cover crops in Minnesota and the Upper Midwest
Published: October 6, 2025 by Vincent Gauthier and Mai Lan Hoang
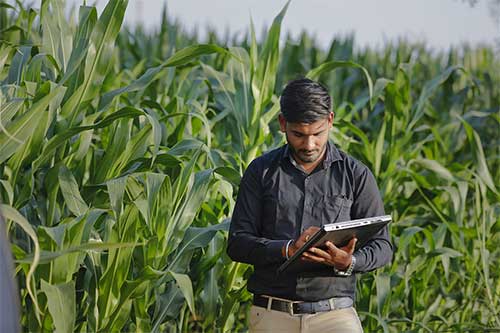
In-depth financial data from 124 farms in Minnesota and surrounding states is helping inform farmers’ cover crop decisions.
Environmental Defense Fund, the University of Minnesota’s Center for Farm Financial Management, the Minnesota State Farm Business Management program and the University of Minnesota Extension’s Southwest Minnesota Farm Business Management Association are leading a collaborative program to help farmers and their partners understand the costs and benefits of growing cover crops.
Since 2022, our program has collected and analyzed detailed cover crop financial data from 124 corn, soybean and other row crop farms across Minnesota, Wisconsin and South Dakota to:
- Evaluate the financial impacts of different species, mixes and uses of cover crops.
- Compare the returns and expenses of commodity crop fields using cover crops to fields without cover crops.
- Assess profitability trends based on farmers’ levels of experience with cover crop production.
- Identify the key factors driving profitable cover crop adoption.
Our project aims to support producer decision-making by analyzing real farm financial data spanning several growing seasons. The findings will also provide valuable insights for federal and local cost-share programs, agricultural lenders and other conservation initiatives focused on improving the financial viability of cover crop adoption.
The economics of cover crops on Minnesota farms: Three-year trend analysis report (2022-2024)
This synthesis report evaluates data collected from 2022 to 2024 to examine trends in the financial impacts of cover crop implementation over time, focusing on a consistent group of 41 Minnesota farms that submitted data for all three years.
Key findings
- Cover crop type strongly influences financial profitability. Across all three years, cover crop costs varied significantly – ranging from $14 to $277 per acre, with a median of $42 per acre. The intended use of the cover crop (e.g., for feed, forage or soil health) was the main factor driving this variation.
- Farmers with the most profitable cover crop fields harvested their cover crops and managed their costs effectively. The farmers of these high-profit fields earned more from harvested cover crops – often used as livestock feed (primarily rye silage) or saved for seed sales – and consistently leveraged cost-share programs to offset expenses.
- Cost-share programs play an important role, but gaps remain. Among producers who received support, cost-share payments covered 54% of total cover crop costs. However, only 27% of farmers received cost-share assistance.
- Timing matters: cover crops pay off before corn, but not soybeans. In all three years, corn fields planted after cover crops were more profitable than the regional average without cover crops. They often had lower costs, including reduced fertilizer expenses, potentially from improved soil health from cover crop mixes. Soybeans, however, had a different impact: fields planted after cover crops were less profitable than the regional average soybean acre without cover crops.
The economics of cover crops on Minnesota farms
Three-year trend analysis report (2022-2024)
Related webinars
Our Experts


-
Financial Solutions for Agricultural ResilienceLearn More