- Resources
- Conservation tillage reduces operating costs
Resources
Conservation tillage reduces operating costs
Published: December 7, 2021 by EDF Staff
Financial benefits of conservation tillage
The positive impact of conservation tillage on the farm bottom line was one of the key findings that arose from our 2021 report, Conservation’s Impact on the Farm Bottom Line. In the face of a changing climate and challenging farm economy, reducing costs of production may be one way for farmers to improve profitability. In our study of seven Midwest growers, we found that:
- Net returns were higher for conservation tillage for both corn and soybeans compared to conventional tillage.
- No-till had lower per-acre costs than conventional tillage for corn and soybeans.
- Conservation tillage saves costs from fuel and oil, machinery, repairs and equipment.
Tillage definitions
For the purposes of this report, we have grouped tillage practices as follows:
- Conventional tillage: Full-width tillage with one or more passes of a disc, chisel, ripper or soil finisher.
- Conservation/Reduced tillage: Tillage that reduces disturbance relative to the farmer’s conventional tillage practice (per definition above), including no-till, strip-till and vertical tillage.
- No-till: Conservation systems where the soil is left undisturbed by tillage equipment.
- Strip-till: The practice of tilling the row where the seed and/or fertilizer will be placed, keeping the residue between the rows undisturbed.
Conservation tillage systems show higher net returns vs. conventional tillage
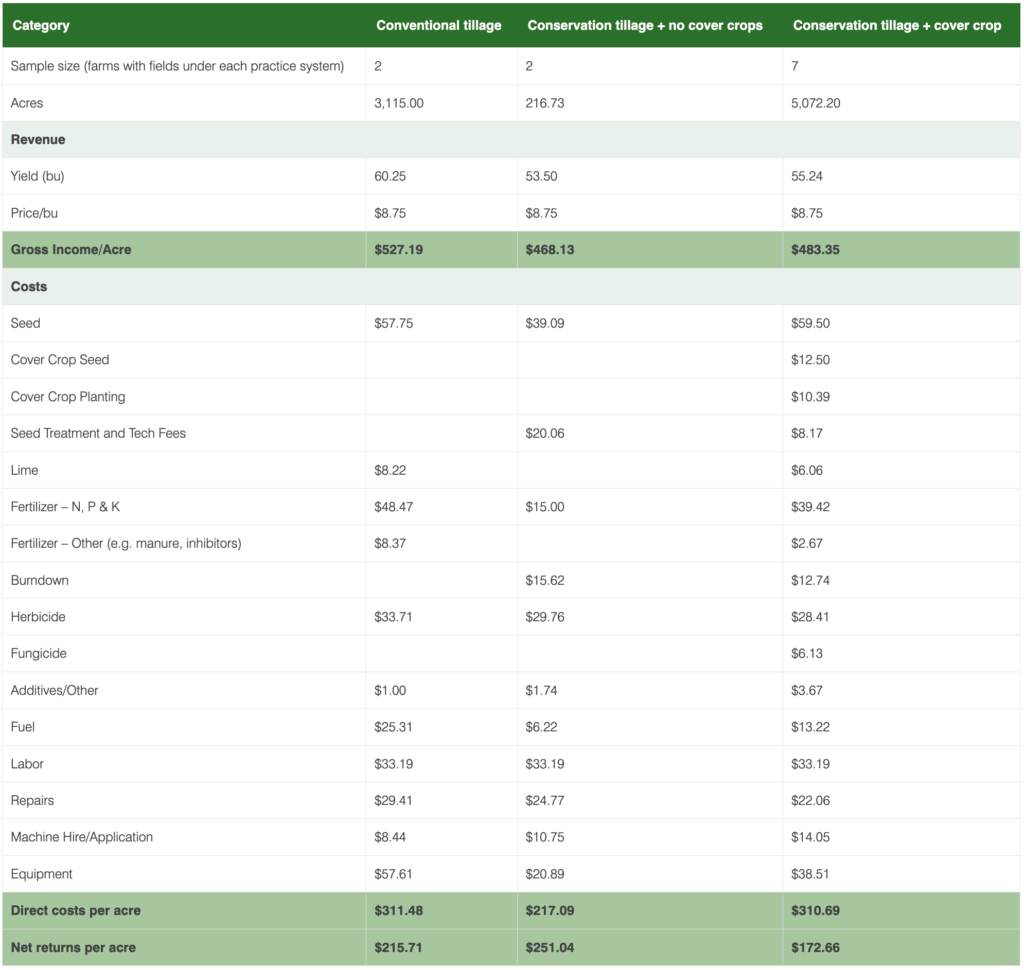
Fields using conservation tillage practices achieved higher net returns per acre than conventionally tilled fields for both corn (Table 1) and soybeans (Table 2). Average net returns for conservation tillage were $377/acre for corn and $251/acre for soybeans, while averages for conventionally tilled fields were $324/acre for corn and $216/acre for soybeans. Tables 1 and 2 detail the average budget line items for conventional tillage, conservation tillage and conservation tillage with cover crops.
Table 1: Average corn crop budgets by tillage type
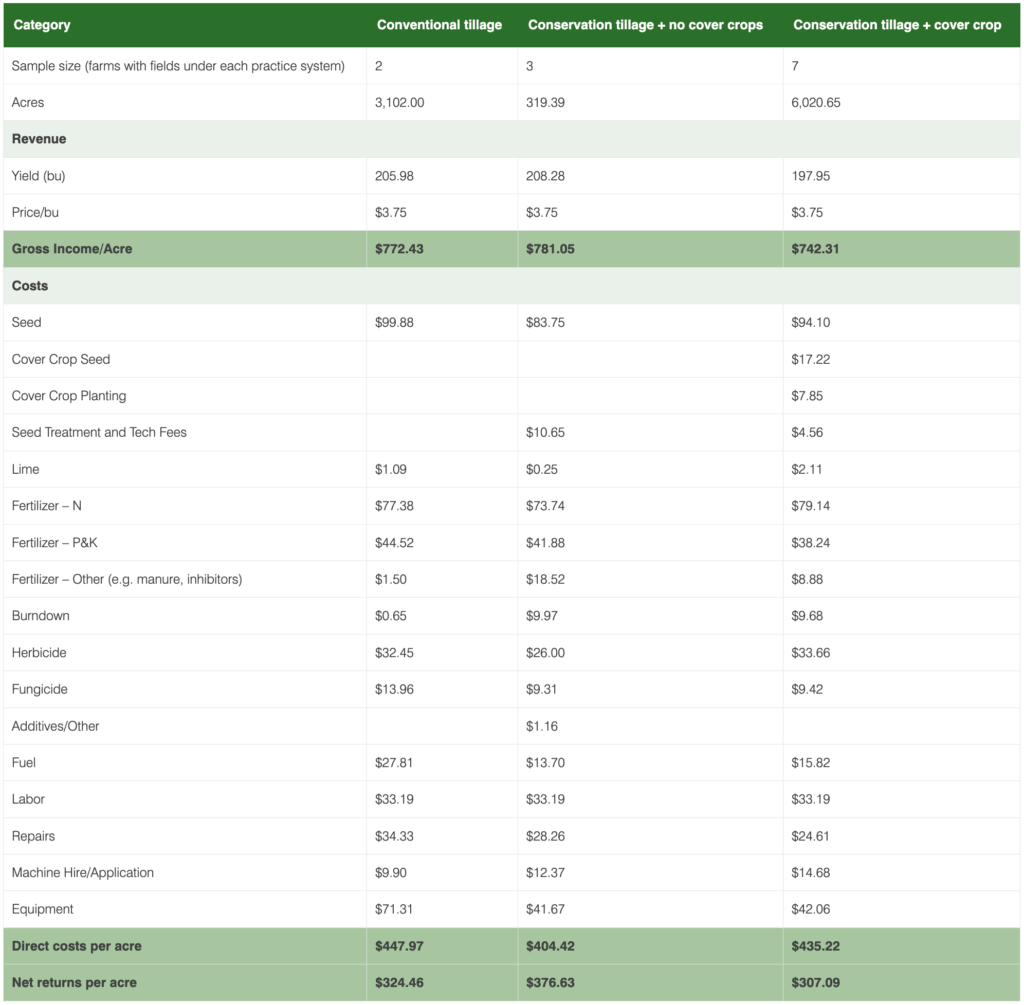
Table 2: Average soybean crop budgets by tillage type
Conservation tillage fields had lower costs than conventionally tilled fields
Conservation tillage practices – including no-till, strip-till or reduced tillage – can provide important cost savings for corn and soybean operations (Figures 1 and 2). In this study:
- Per-acre costs for corn fields with conservation tillage were lower ($404/acre) than those for conventionally tilled fields ($448/acre). Even after adding cover crop costs, corn fields using conservation tillage and cover crops had lower per acre costs ($435/acre) than conventionally tilled fields ($448/acre).
- Soybean fields with conservation tillage and no cover crops ($217/acre) had substantially lower per-acre costs than conventionally tilled fields ($311/acre).
- Soybean fields using conservation tillage and cover crops had similar costs to conventional tillage.
Figure 1: Per-acre costs by tillage practice for corn

Figure 2: Per-acre costs by tillage practice for soybeans

Savings on fuel, repairs and equipment make conservation tillage systems more profitable
By decreasing the number and/or intensity of tillage passes, farmers were able to save money. Table 3 shows the amount of cost savings (positive numbers) and cost increases (negative numbers) associated with conservation tillage and conservation tillage with cover crops when compared to conventional tillage without cover crops on corn fields. The most substantial savings from no-till on corn came from equipment and fuel costs. Conservation tillage acres with and without cover crops did, however, have increased burndown costs due to using herbicide to kill weeds prior to planting (rather than relying on tillage for weed control).
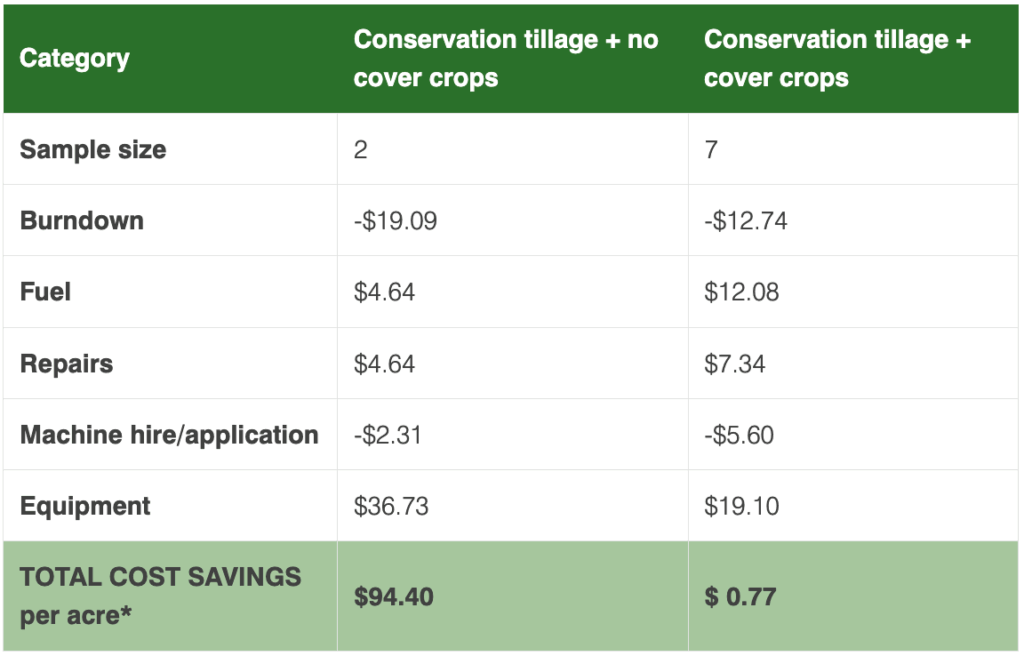
Farmers using conservation tillage on their soybean acres also showed substantial cost savings. Like Table 3, Table 4 shows the amount of cost savings (positive numbers) and cost increases (negative numbers) associated with conservation tillage and conservation with cover crops when compared to conventional tillage without cover crops on soybean fields. The table demonstrates that farmers using conservation tillage had substantially lower equipment and fuel costs compared to conventional tillage. Again, conservation tillage on soybean fields included increased costs in burndown and machine hire and application.
Table 3: Cost savings associated with conservation tillage production systems as compared to conventional tillage with no cover crops, corn
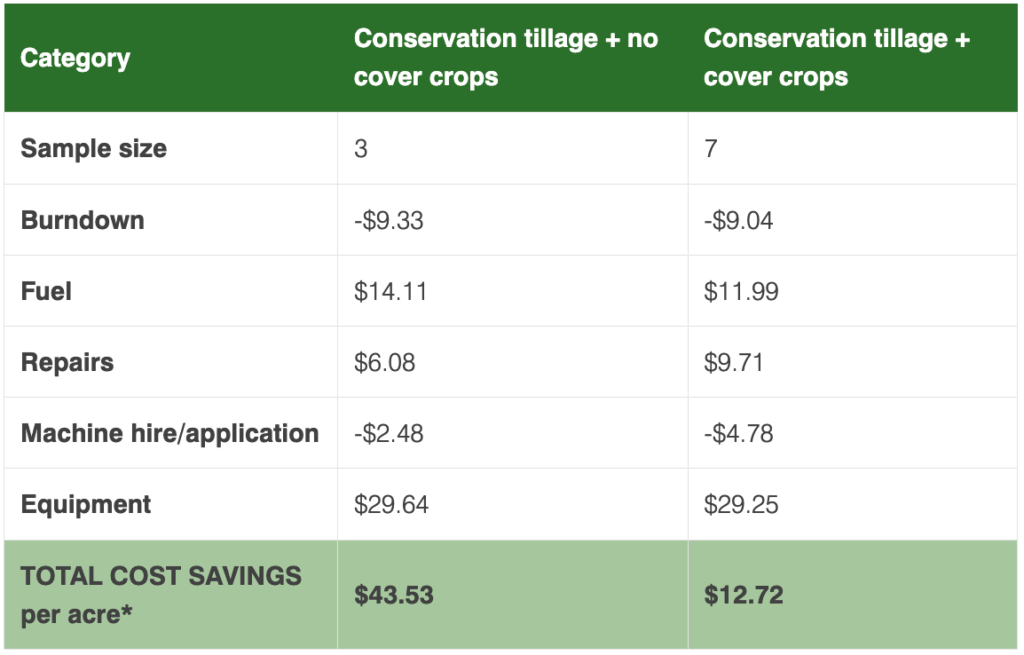
Table 4: Cost savings associated with conservation tillage production systems as compared to conventional tillage with no cover crops, soybeans
A note on yield:
In our sample, corn yield was not significantly different between tillage practices (range: 202-206 bushels (bu) per acre). Soybean acres, however, seemed to show slightly lower yields for conservation tillage with and without cover crops (55 and 53 bu/acre, respectively), compared to conventionally tilled fields (60 bu/acre). Yield outcomes in this study should be considered anecdotal, due to the small sample size and geographic distribution across the Midwest, as well as the fact that farmers may target specific practices to specific acres that may have other characteristics associated with yield.
Conservation’s impact on the farm bottom line
In the face of a changing climate and challenging farm economy, reducing costs of production may be one way for farmers to improve profitability.
Our Experts


-
Financial Solutions for Agricultural ResilienceLearn More